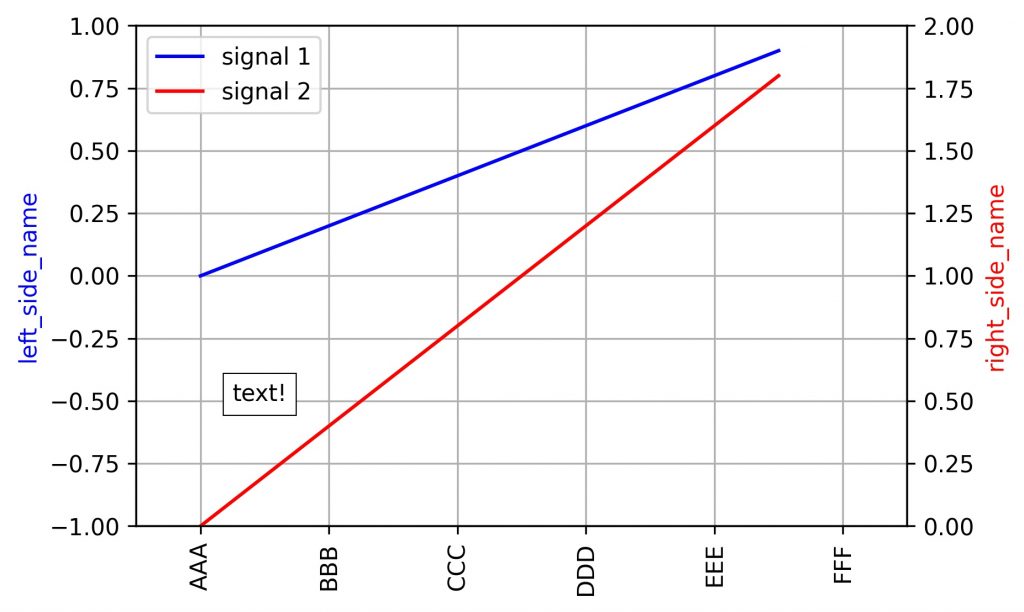
以下のように、右と左に軸を持つグラフを描きたい場合のコードです。

import matplotlib.pyplot as plt
import numpy as np

# データ生成
s1 = np.arange(0, 1, 0.1)
s2 = np.arange(0, 1, 0.1) * 2

# メイン処理
fig = plt.figure()
ax1 = fig.subplots()
ax2 = ax1.twinx()
ax1.plot(s1, label="signal 1", c="b")
ax2.plot(s2, label="signal 2", c="r")
ax1.set_ylabel("left_side_name", c="b")
ax2.set_ylabel("right_side_name", c="r")
a1, b1 = ax1.get_legend_handles_labels()
a2, b2 = ax2.get_legend_handles_labels()
ax1.legend(a1 + a2, b1 + b2)
ax1.grid(True)

# 左右軸のレンジ
ax1.set_ylim([-1, 1])
ax2.set_ylim([0, 2])

# 横軸のレンジ(同じ値にすること)
ax1.set_xlim([-1, 11])
ax2.set_xlim([-1, 11])

### 以下はオプション ###

# 横軸を文字にしたい&回転したい場合
# xnum = [0, 2, 4, 6, 8, 10]
# xstr = ["AAA", "BBB", "CCC", "DDD", "EEE", "FFF"]
# ax1.set_xticks(xnum)
# ax1.set_xticklabels(xstr, rotation = 90)

# テキストを入れたい場合
# plt.text(0.5, 0.5, "text!", size=10, horizontalalignment="left", bbox={"linewidth":"0.5", "facecolor":"white"})

# 保存したい場合
# fn = "aaa.jpg"
# plt.savefig(fn, dpi=300, bbox_inches='tight')